雅思写作:雅思小作文真题
阅读量:
雅思小作文真题
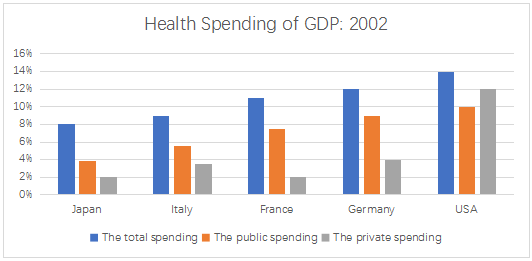
The chart below shows the health spending among five different countries in 2002.

范文及解析
In the bar chart is the health spending of GDP in five countries, and the time investigated is the year of 2002.

图表分析&写作思路:1. 美国:三项均;灰色>橘色2. 日意法德:三项略低;橘色>灰色3. 注意数据的取舍
The USA presented the highest total health expenditure as a share of GDP among these five countries, amounting to 14 percent. What also makes the difference compared to other countries is its significantly higher public spending as well as its private spending on health care service: 10% and 12% respectively.
Japan, Italy, France and Germany followed the U.S. with distinctly smaller percentages in all three categories. That year, none of the four total expenditures of GDP exceeded 12%, and Japan, with the lowest spending, allocated merely 8% on total level, 4% on public level and 2% on individual level. Noticeably, in these four countries, the percentage of the public cost was higher than that of the private one, especially in France, where the former almost quadrupled the latter.
Overall, the year of 2002 witnessed varied proportions of total, public and private spending in these five countries.
更多关于雅思考试的个性化问题敬请咨询新航道官网
