雅思小作文之去哪儿旅游?
阅读量:
雅思小作文真题

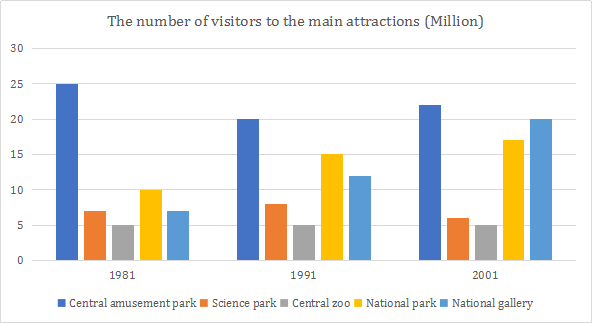
The bar chart below shows the number of visitors to the main attractions in a European country in 1981, 1991 and 2001.


范文及解析
The bars are the illustrations of how many visitors went to the five main attractions in a European country in three separate years: 1981, 1991 and 2001.
分组1:的景点VS. 最不爱的景点
It is notable that in all three years, central amusement park was visitors’ favorite, with the number of arrivals staying above 20 million annually <借状语写数据>. Significantly less popular than it, science park and central zoo received under 8 million tourists in each of the three years <不求数据面面俱到,重点把握“景点间宏观数据对比”. Central zoo, the least attractive one <同位语给出景点间的对比>, was particularly noteworthy, as all the three years witnessed no change in tourist number (5 million).
分组2:剩余两大景点&都可见访客增多
In 1981, 10 million visitors chose national park as their destination and 7 million chose national gallery. On this year’s level, the popularity increased in 1991, when the attendances were both up by 5 million, <数据间的同:都比10年前多;数据间的异:1991年的增额vs.> while another decade later, the growth in the latter was more marked: 8 million in comparison with 2 million.
Overall, there were more tourists visiting this country, whose choices towards these attractions varied over the three years.
小结:数据较多时,要学会舍弃部分,更关注宏观异同对比;句子主语要多样,语法现象要多样。
更多关于雅思考试的个性化问题敬请咨询新航道官网
